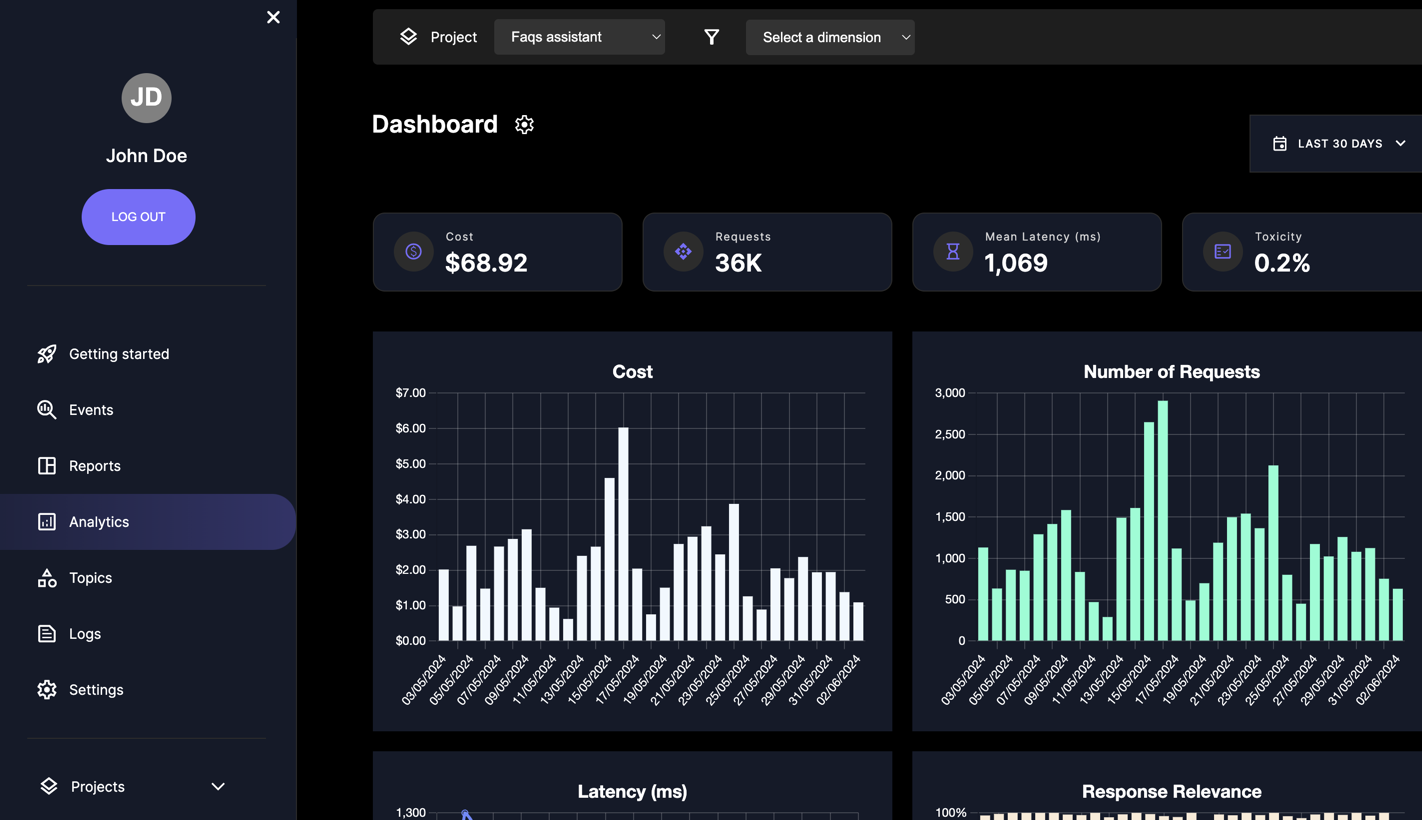
Analytics Dashboard
Gain an instant overview of your Conversational AI performance and make informed decisions using the “Analytics” dashboard. Follow these simple steps to efficiently customize the Analytics dashboard.
Step-by-Step Guide
Navigate to the Analytics Section
On the left-hand menu, click on "Analytics" to access the Analytics dashboard.
Select the Project
Use the "Project" dropdown at the top of the dashboard to select the specific project you want to analyze.
Choose a Dimension
Click on the "Select a dimension" dropdown to filter your data by specific properties such as Users, User Demographics, Device Type, Digital Humans, or other properties that are important to you.
Remember: The entire Analytics page will be filtered based on the dimension selected!
Set the Date Range
Use the date dropdown on the right to choose between “Last 7 Days” or “Last 30 Days” to view data within the selected timeframe.
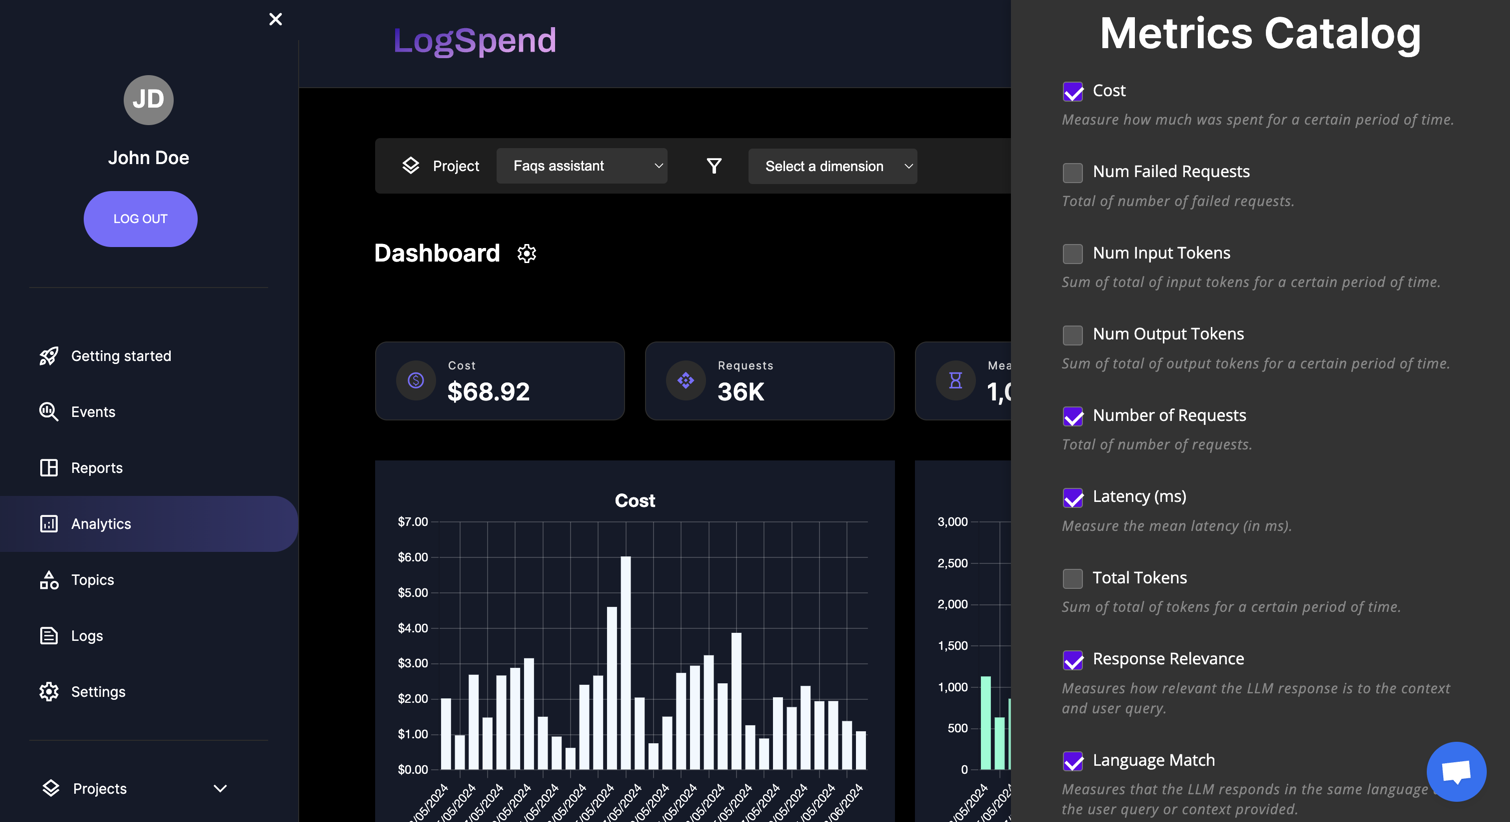
Access the Metrics Catalog
Click on the settings gear icon next to “Dashboard” to access the “Metrics Catalog”.
Select Metrics to Display
In the “Metrics Catalog”, check the boxes for the metrics you want to display on the Analytics page. Available metrics include:
- Language Match
- User Sentiment
- Toxicity
- Gender Bias
- Cost
- Number of Failed Requests
- Number of Input Tokens
- Number of Output Tokens
- Number of Requests
- Latency (ms)
- Total Tokens
View and Analyze Data
Once you have selected your metrics, they will be displayed on the Analytics dashboard. You can now analyze your data based on the chosen filters and dimensions.