Creating Reports
Easily track and share key performance metrics with your team using LogSpend's “Reports” feature. This section will guide you through creating detailed reports that can be shared for weekly check-ins, monthly performance reviews, and more.
Step-by-Step Guide
Navigate to the Reports Section
On the left-hand menu, click on "Reports" to access the Reports dashboard.
Select a Project
Click on a project that the report should track from the bottom left "Projects" overview.
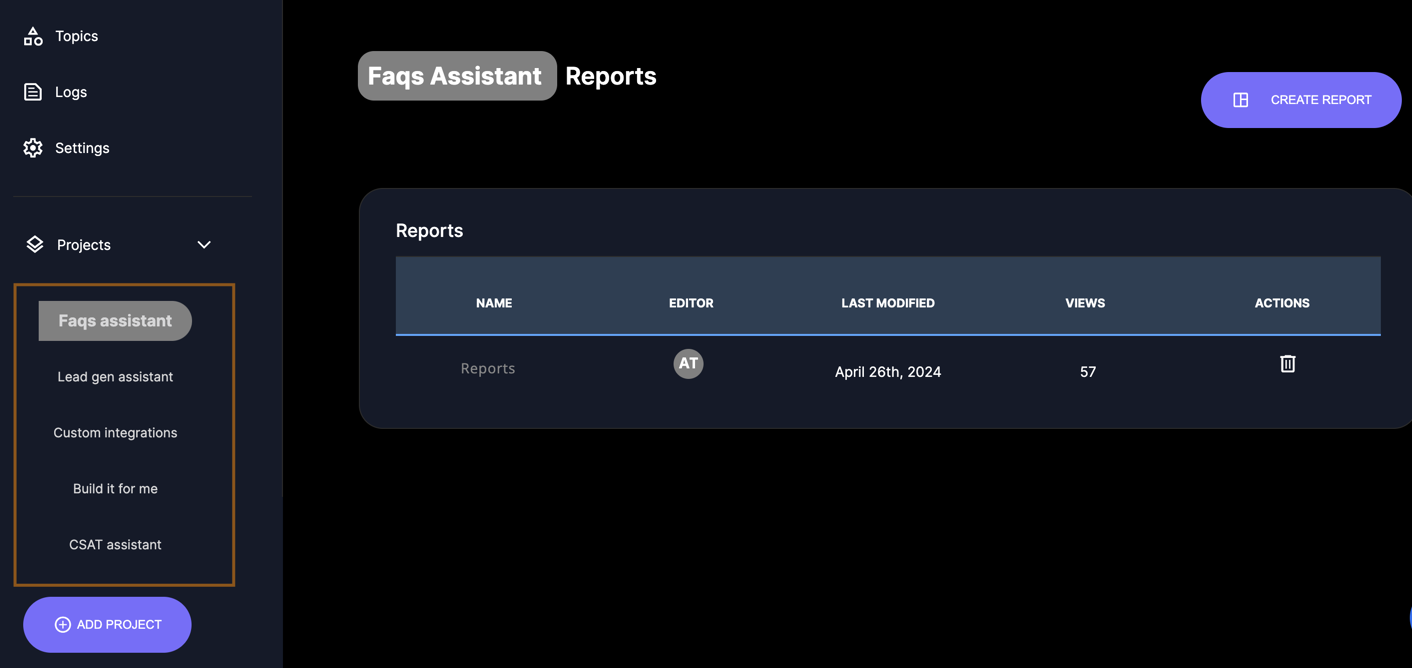
Create a Report
Click on the "Create Report" button.
Add Report Name
Enter a report name, such as "Weekly Check-In".
Add a Metric
Click a widget to add a metric you'd like to track.
Select a Metric
Use the "Metric A" dropdown menu to select a metric you want to display.
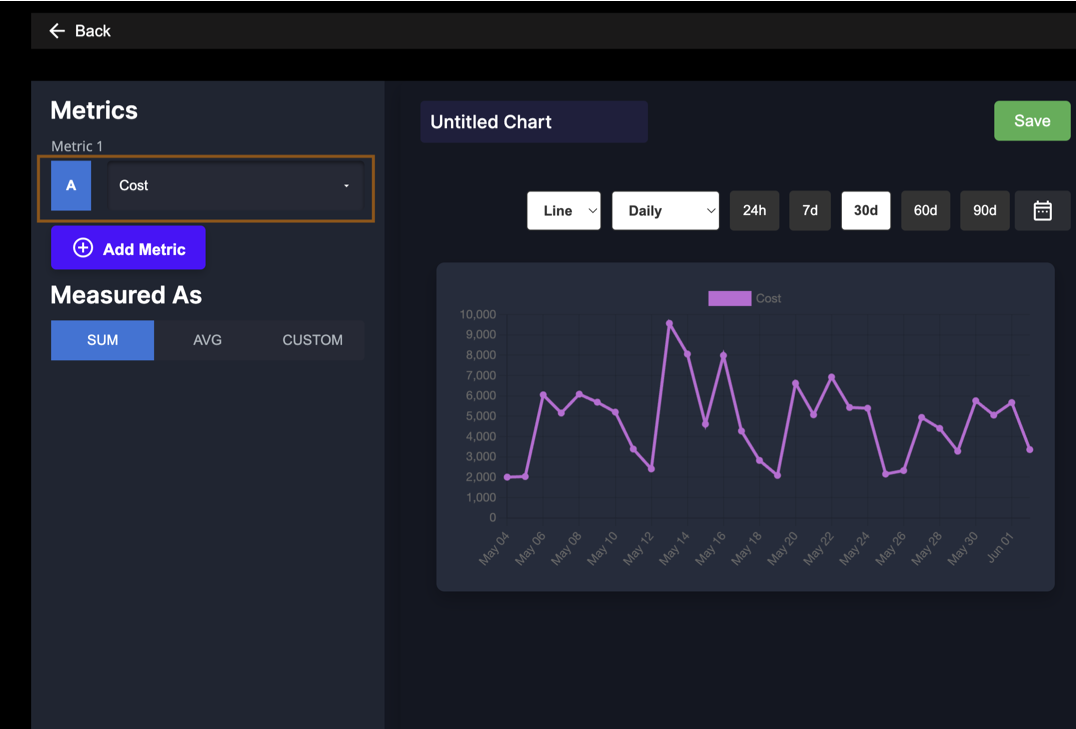
Choose Chart Type
Select a chart type (Line or Bar diagram).
Set Time Interval
Choose the time interval for the metric display (hourly, daily, weekly, monthly, quarterly, or yearly).
Select Time Frame
Choose the time frame for the data (e.g., last 7 days, last 30 days).
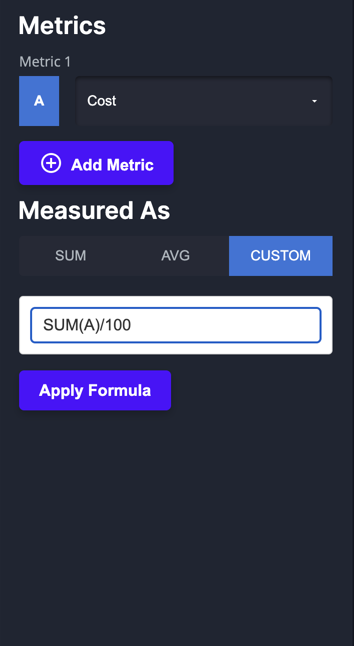
Measure As
Select how the metric should be measured (Sum, Average, or Custom).
For custom metrics, enter the formula and click “Apply Formula” e.g., “SUM(A) / 100” to observe costs in euros instead of cents.
Save the Chart
Name the chart and click "Save" to add it to the report.