Topics Dashboard
Discover key trends and understand user discussions by leveraging the “Topics” section. Follow these steps to navigate and analyze the most relevant topics effectively.
Step-by-Step Guide
Navigate to the Topics Section
On the left-hand menu, click on "Topics" to access the Topics dashboard.
Select the Project
Use the "Project" dropdown at the top of the dashboard to select the specific project you want to analyze.
Choose a Dimension (if applicable)
Click on the "Select a dimension" dropdown to filter your data by specific properties such as Users, User Demographics, Device Type, Digital Humans, or other properties that are important to you.
Remember: The entire Topics page will be filtered based on the dimension selected!
Set the Date Range
Use the date selectors on the right to set the date range. You can choose between predefined ranges such as “Last 7 Days”, “Last 30 Days”, or specify a custom date range.
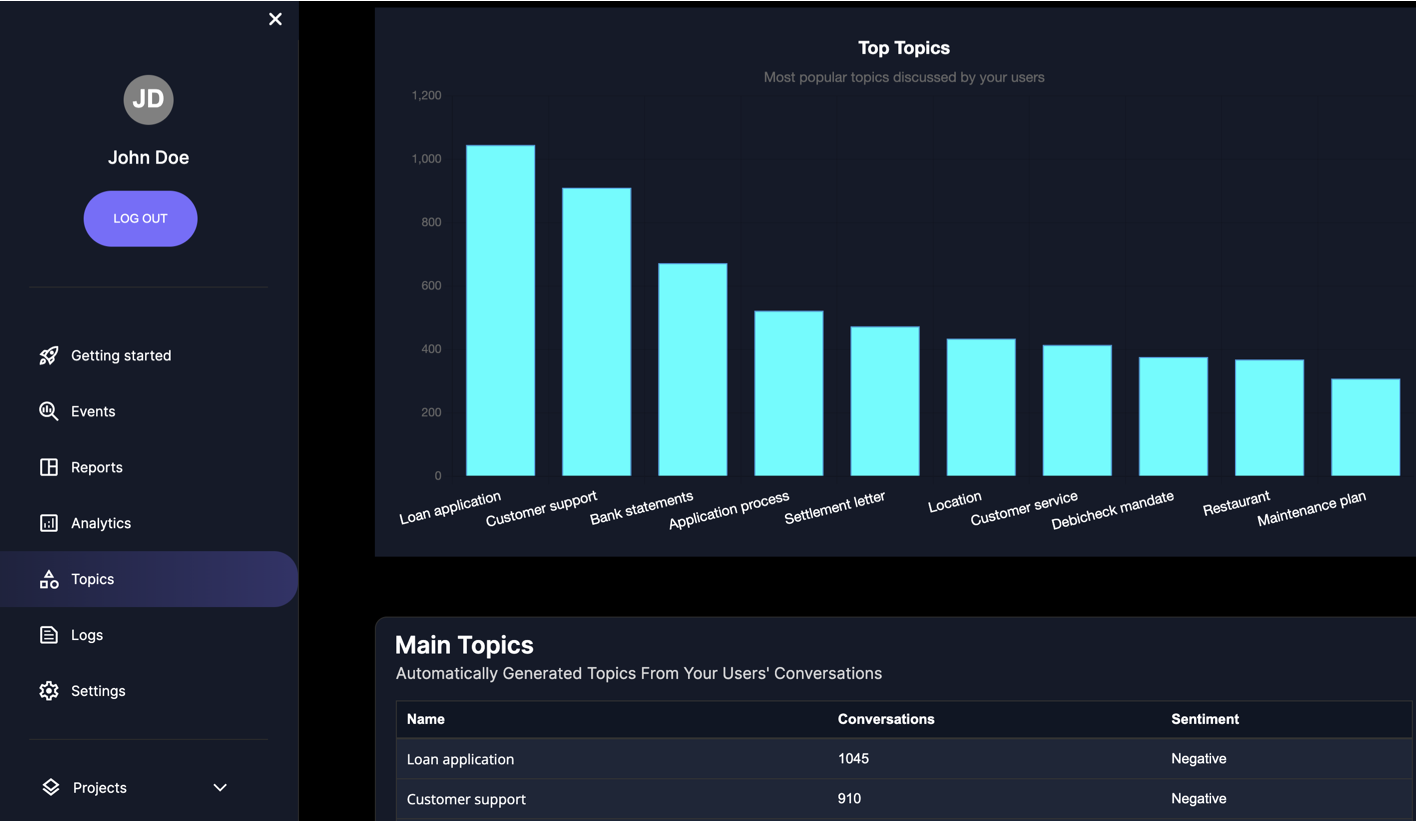
Browse the Main Topics
The “Main Topics” overview displays the most popular topics discussed by your users. Browse through this list to find topics of interest.
Investigate a Specific Topic
Click on a topic in the “Main Topics” overview to investigate it further. This will open a detailed view of the selected topic.
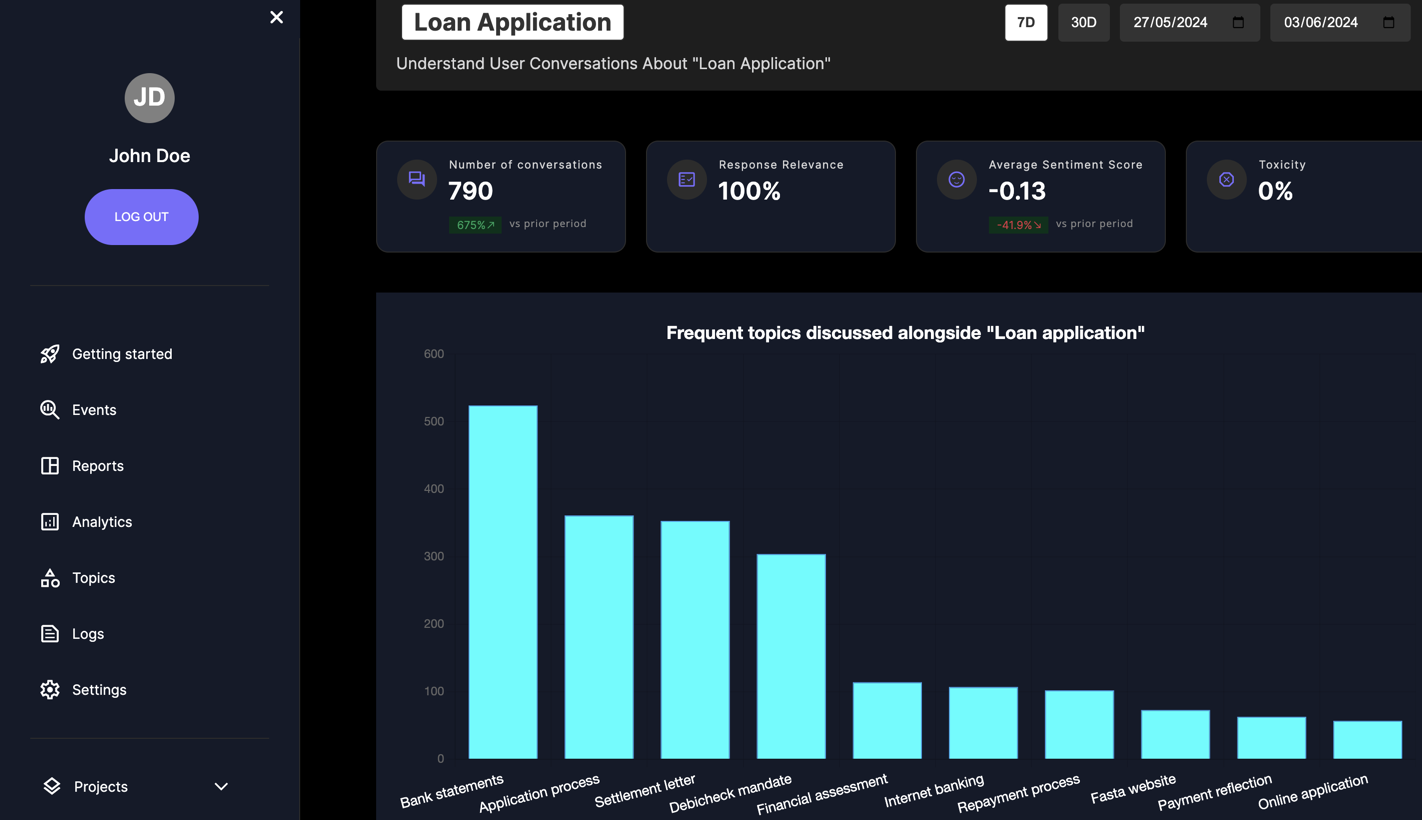
Analyze Conversation KPIs
In the detailed view, analyze main KPIs around the selected topic, such as:
- Number of conversations
- Response Relevance
- Average Sentiment Score
- Topics frequently discussed alongside the selected topic
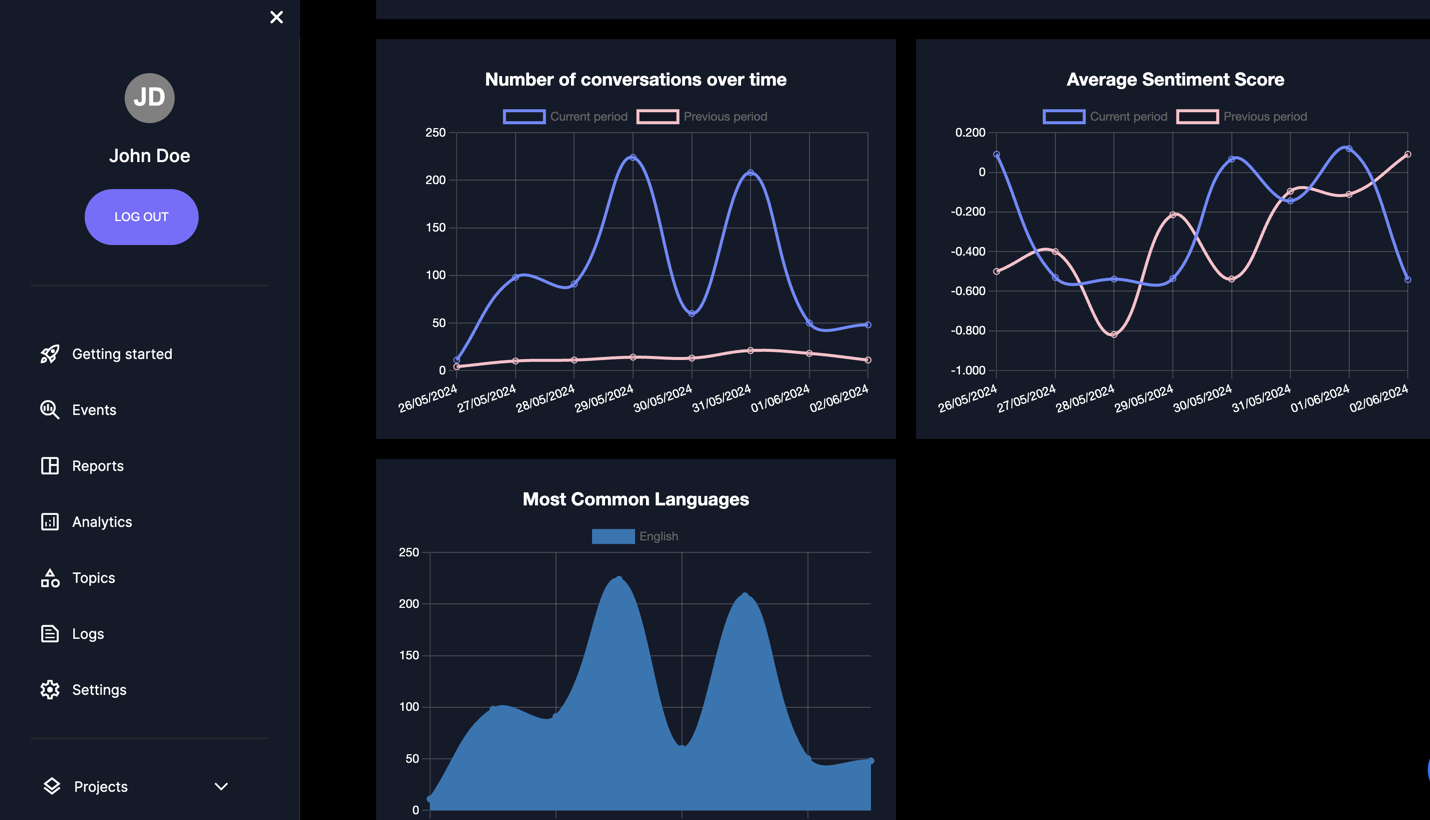
- Week over Week Performance comparison
Tips for Effective Topic Analysis
- Focus on Relevant Topics: Concentrate on topics that are most relevant to your business goals.
- Monitor Trends: Regularly check the topics to identify emerging trends and address them promptly.